

 تغريدة
 The Wall Thermometer Problem
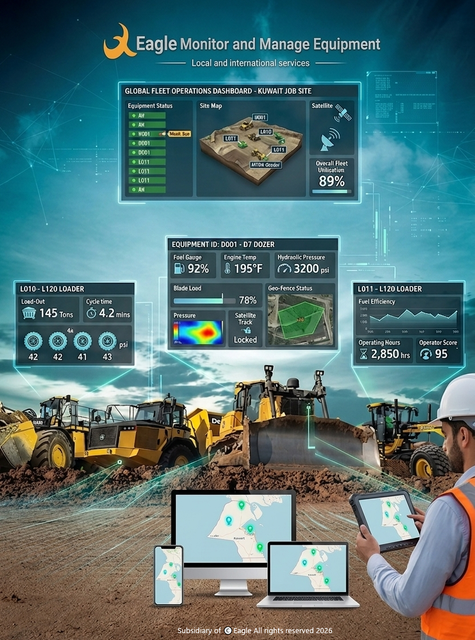
A thermometer on a warehouse wall reports the temperature of that wall. The pallets stacked ten metres up beside the roof sheeting, the cartons staged at a sunlit dock door, and the stock in a corner behind the compressor each live in a different climate. Warehouse temperature monitoring built around sensors in the right spots, and connected to the live fleet system that tracks every inbound and outbound truck, treats the building and the vehicles as one chain.
The route of a single pallet, from truck to rack and back out again, makes a useful guide. Each step along it shows where a monitoring system earns its keep.
Map the Building Before You Instrument It
Place 15 to 30 loggers on a grid across floor level, mid-rack, and top rack for 48 to 72 hours, including a weekend and at least one hot afternoon. Fleet management system international FMSI provider The map that comes back usually surprises owners. Picture a 6,000 square metre warehouse in Sulaibiya that shows a gap of 8°C between the floor and the highest rack in July, plus a 5°C hot patch behind the dock doors. (Illustrative hypothetical figures; a real mapping study produces site-specific data.)
Those findings decide where permanent sensors go, which racks hold sensitive stock, and whether extra ventilation or insulation is worth the money. Pharmaceutical and food auditors ask for mapping studies anyway, so the work pays twice.
Wireless, Wired, or Both
Sensor choice depends on the building. LoRa-based sensors cover large floor areas with a gateway or two, with battery life that stretches to 2 to 5 years at 5-minute intervals. Bluetooth tags suit pallets and totes that move around. Wired probes still make sense inside cold rooms, where ************l walls hamper radio and a hard-wired reading brings peace of mind.
Pick sensors with calibration certificates, publish a calibration schedule, and keep spares on a ************f. Most sites end up with a mix: wired in the freezer, LoRa on the racks, Bluetooth on the trucks. Gateways need power backup and a cellular fallback for the day the internet line fails. (Typical ranges quoted for illustration; verify with the manufacturer.)
The Dock Door, Where Truck Meets Building
Live fleet data pays its biggest dividend at the dock. When a reefer truck is twenty minutes out, the platform notifies the warehouse so the dock team can pre-cool the bay, free a door, and prepare staff. On arrival, the system records the truck’s return-air temperature, and the receiving team compares it with the setpoint before opening the doors.
If the load sits outside limits, the acceptance or rejection is logged with a timestamp, and the supplier can be shown the trace. Door-open time at the dock and the temperature rise it caused go on the dock dashboard. A dock ************ter and a strip curtain cost little, and the door-open trace shows quickly whether they pay off.
When the Grid Blinks
A power dip at 2 p.m. in August puts the whole building to the test. Automatic transfer switches take a few seconds to hand the load to the standby generator, chillers restart on a delay to protect their compressors, and cold rooms ride on thermal mass in the meantime. A warehouse platform that also monitors the generators sees mains status, transfer events, fuel level, run hours, and battery voltage.
A fuel level that has dropped to 25 percent triggers a refill order before the next dip arrives. Chiller status and compressor fault codes sit on the same screen as the room temperatures. After a summer peak-load shedding event, the log shows how long each room stayed within limits, which settles insurance conversations. (Illustrative thresholds; set them with your electrical and refrigeration engineers.)